MAPS performance: Difference between revisions
No edit summary |
(Removing tables before final data is available.) |
||
| (25 intermediate revisions by 4 users not shown) | |||
| Line 1: | Line 1: | ||
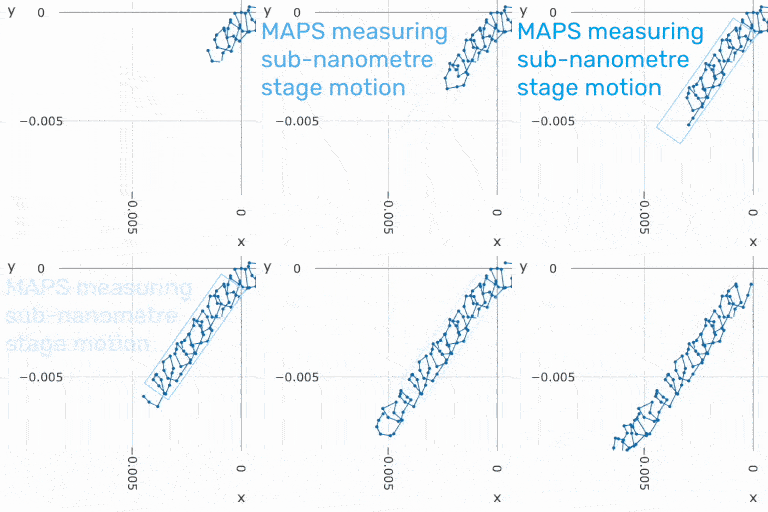
[[File:Trochoid 1nm.gif|alt=|MAPS in-house, 6DoF nano-positioning demo. Scale in µm, dots are approximately the size of atoms being measured.|frame]] | |||
Sensor performance criteria quoted industry-wide are often ill defined or plain misleading. MAPS performance is assessed in several ways, each with different utility. These specifications are explained here. | |||
== Definitions == | == Definitions == | ||
=== Accuracy === | === Accuracy === | ||
Accuracy measures how close the result is to the actual value we were trying to achieve. The accuracy values shown below are based on our simulated tests. In our case, the accuracy is the maximum error belonging to a certain axis (x, y, z) or angle (pitch, yaw, roll) that we got during the 10000 random decodes. | |||
=== Precision === | |||
Precision measures the consistency of our system and gives information about the relative accuracy in application. High precision is enough if achieving a high global accuracy is not needed but to measure the degree of displacement. In our case, the precision is the standard deviation of the errors belonging to the above-mentioned 10000 decodes and the confidence intervals with a 95% confidence level. The precision could still be high even if the accuracy is low. | |||
=== Resolution === | === Resolution === | ||
Resolution shows the theoretical accuracy of our system, i.e. the absolute limit of the technology. | |||
=== Noise floor === | |||
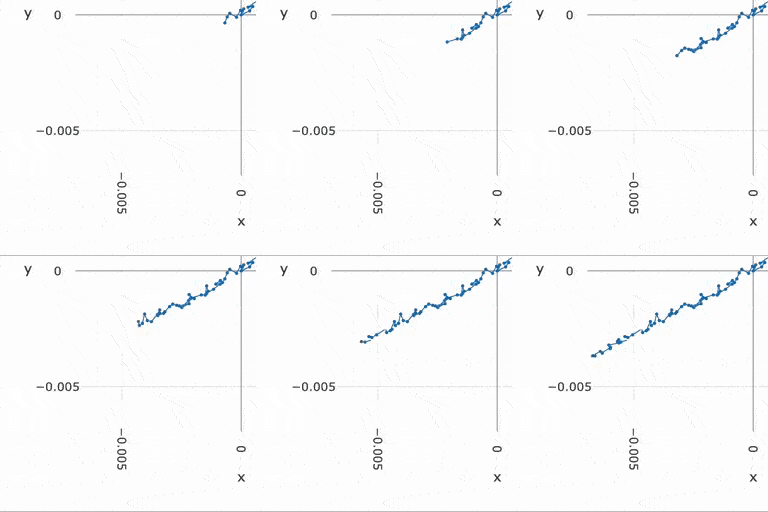
Noise floor measures the degree of change in a stationary state, which is originated from the real tests. | |||
=== Repeatability === | === Repeatability === | ||
Repeatability shows if the results can reliably be repeated in various setups. In the case of the MAPS device, experiments have been conducted at NPL (National Physical Laboratory), and they have been meaningfully repeated in our own laboratory. Simulated tests have also been conducted. | |||
=== | === Conditions === | ||
== Results == | |||
== OnlineLab examples == | |||
<gallery widths="256" heights="256"> | |||
File:Trochoid 10nm.gif | |||
File:Trochoid 1nm.gif | |||
File:LabDriftNoise.gif | |||
</gallery> | |||
Latest revision as of 15:53, 19 December 2023
Sensor performance criteria quoted industry-wide are often ill defined or plain misleading. MAPS performance is assessed in several ways, each with different utility. These specifications are explained here.
Definitions
Accuracy
Accuracy measures how close the result is to the actual value we were trying to achieve. The accuracy values shown below are based on our simulated tests. In our case, the accuracy is the maximum error belonging to a certain axis (x, y, z) or angle (pitch, yaw, roll) that we got during the 10000 random decodes.
Precision
Precision measures the consistency of our system and gives information about the relative accuracy in application. High precision is enough if achieving a high global accuracy is not needed but to measure the degree of displacement. In our case, the precision is the standard deviation of the errors belonging to the above-mentioned 10000 decodes and the confidence intervals with a 95% confidence level. The precision could still be high even if the accuracy is low.
Resolution
Resolution shows the theoretical accuracy of our system, i.e. the absolute limit of the technology.
Noise floor
Noise floor measures the degree of change in a stationary state, which is originated from the real tests.
Repeatability
Repeatability shows if the results can reliably be repeated in various setups. In the case of the MAPS device, experiments have been conducted at NPL (National Physical Laboratory), and they have been meaningfully repeated in our own laboratory. Simulated tests have also been conducted.


